A fictional map for a potential lightrail network in Noord-Brabant.
Brabantrail is a project I’ve been working on for a hot while, it’s my first major map project.
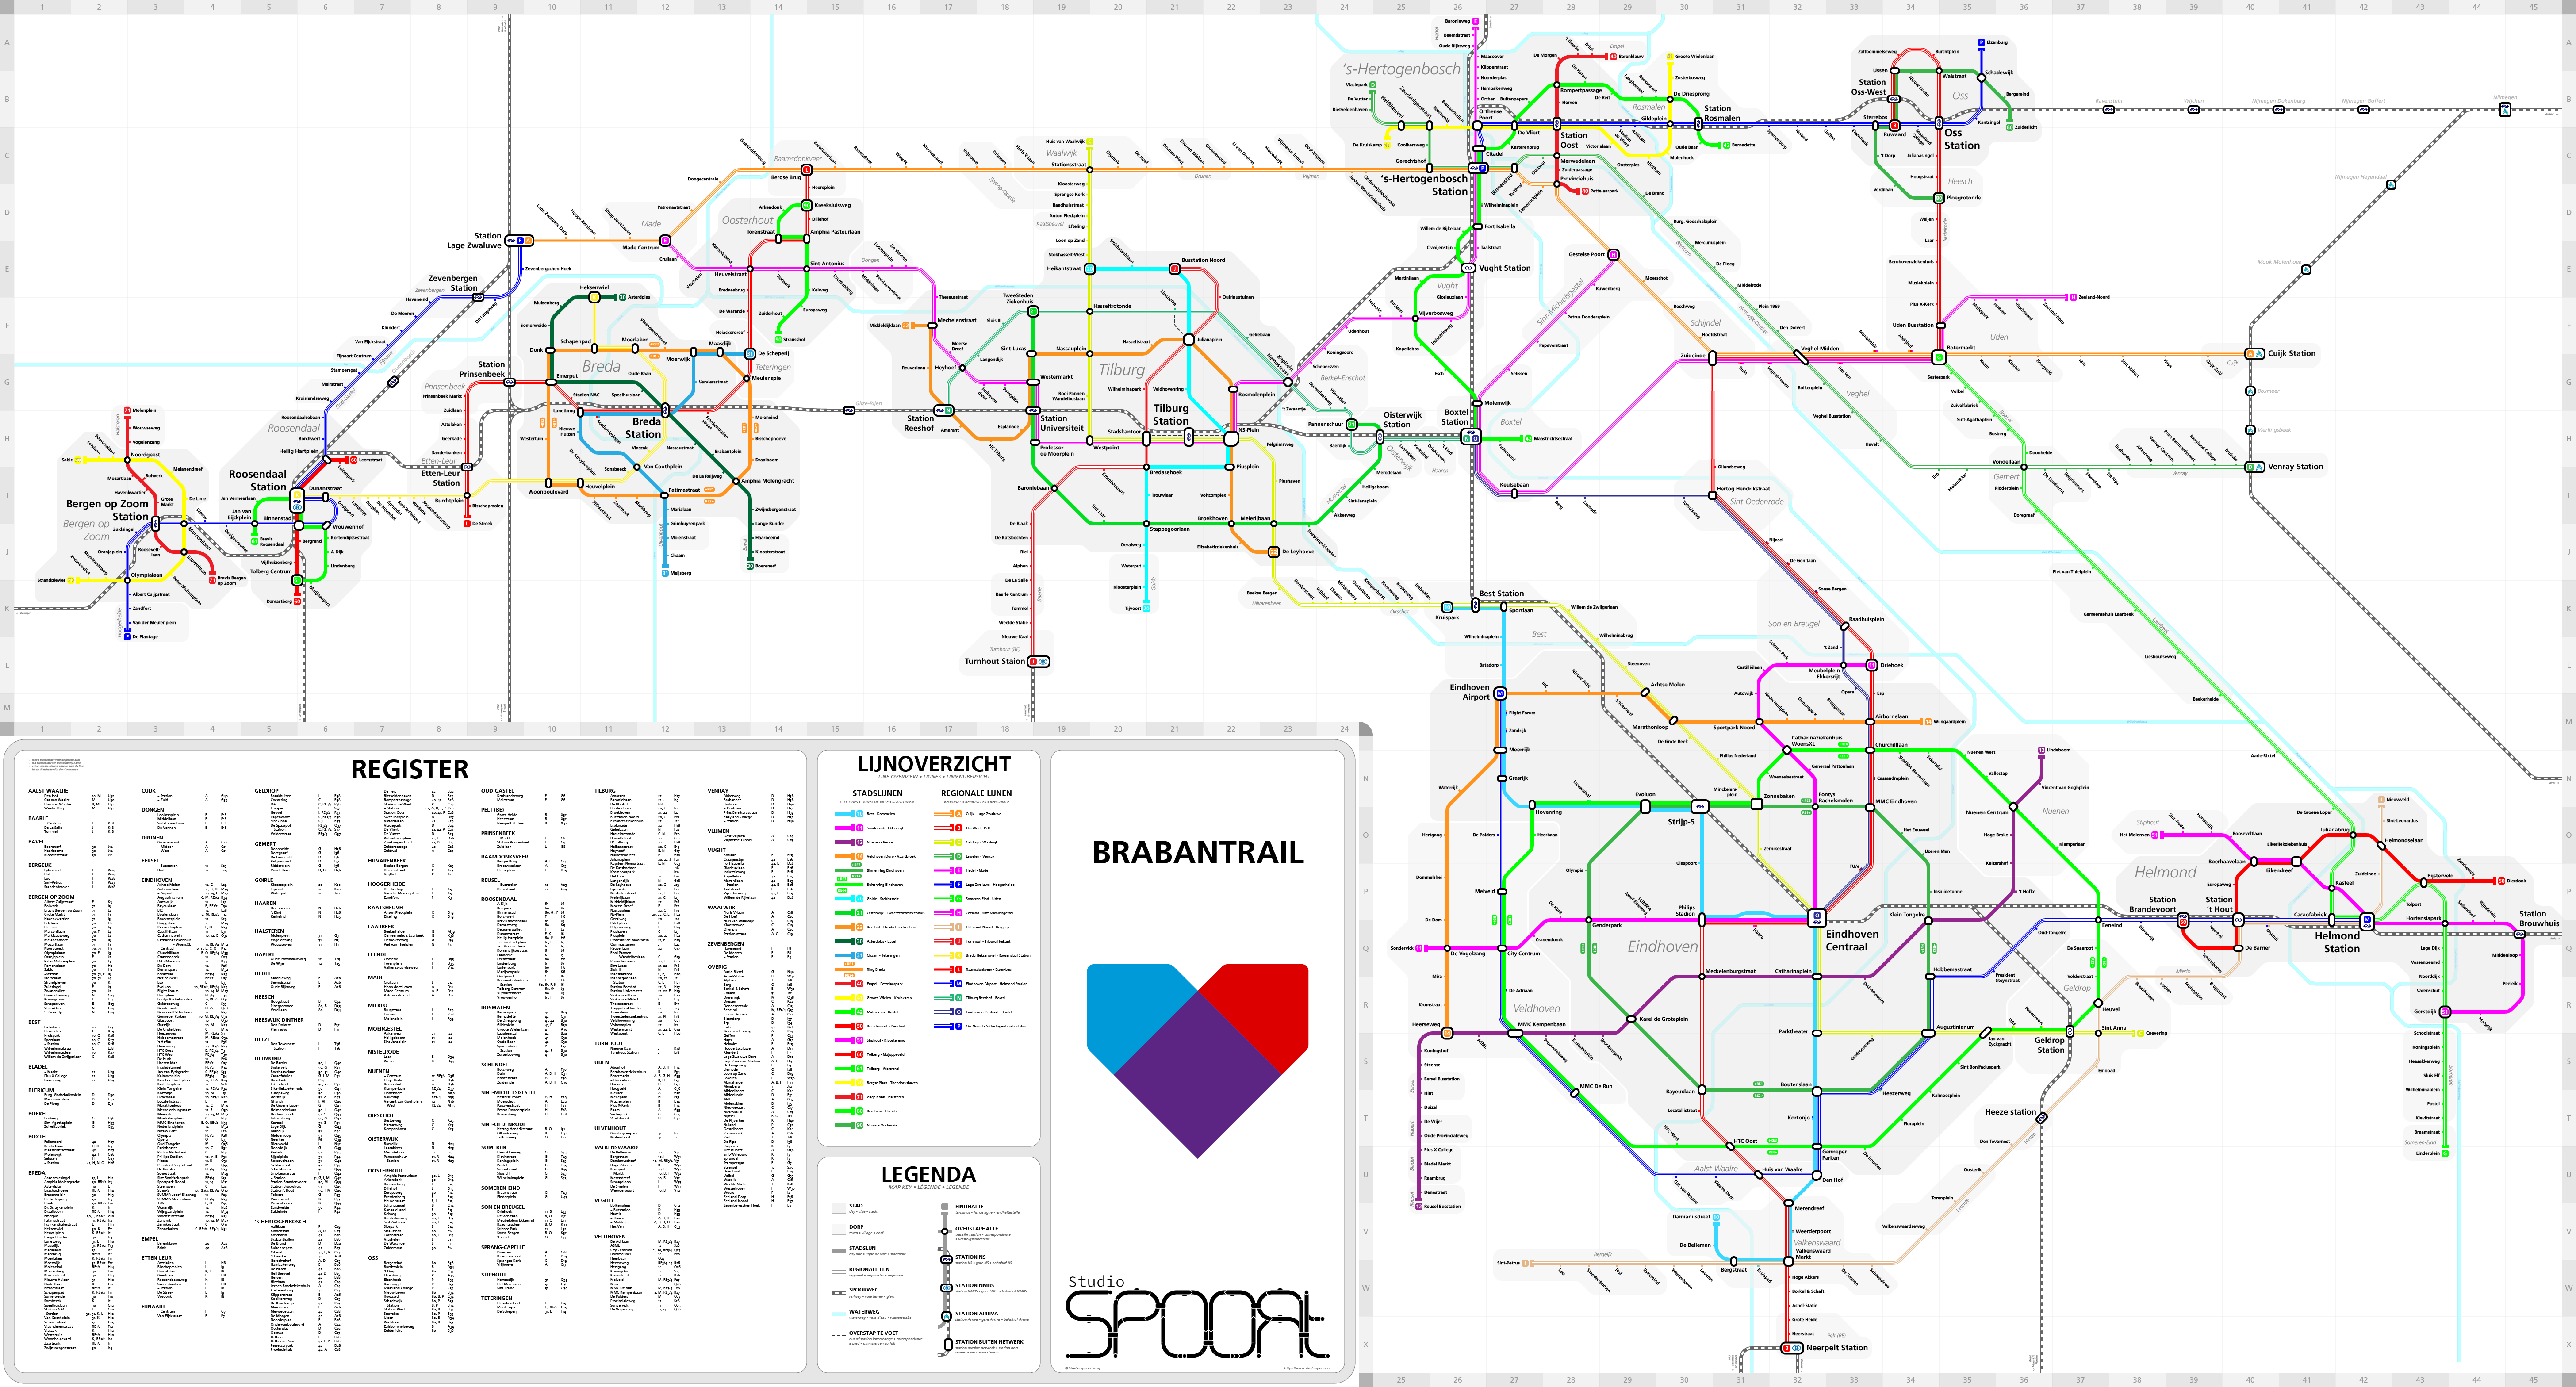
A full-scale pdf can be found here or by clicking on the image above.
Introduction
Noord-Brabant, or simply Brabant is the 3rd biggest province in the Netherlands by population. It holds 3 out of the 10 biggest cities in the country, namely Eindhoven (#5), Tilburg (#7) & Breda (#9). The capital ‘s‑Hertogenbosch holds historical significance and is the 4th largest city in the province.
Currently, the province has around 2.65M people spread across a multitude of cities and big towns. Most of the cities are connected with IC rail to the rest of the nation. Breda is branched of the HSL-Zuid, connecting it with high-speed rail to Rotterdam, Amsterdam and Antwerp. Eindhoven and ‘s‑Hertogenbosch have high-frequency IC rail connecting to Utrecht and Amsterdam to the North, while branching off to various cities in Limburg to the South.
Historically though, there 4 more mainline railways connecting the province. These incude:
- Bels Lijntje (Spoorlijn 29) [NL] - connecting Tilburg to Turnhout (BE)
- Spoorlijn 18 [NL] - connecting Eindhoven to Pelt (BE) and Hasselt (BE)
- Langstraatspoorlijn or Halvezolenlijntje - connecting Lage Zwaluwe to ’s-Hertogenbosch via Waalwijk
- Duits Lijntje [NL] - connecting Boxtel to Goch (DE) via Uden
Because none of these lines were ever electrified or multi-track, they were closed in the 20th century. Various bits of track remain, but service has been gone for a while. However their right of way is still clearly visible on maps, so I made good use of those on my map wherever possible.
System Design and Numbering
The lightrail system I’ve designed has two line types: City and Regional.
Regional
These lines are lettered A-P, sorted by the length of the line.
A line is regional when it crosses through multiple agglomerations.
They’re also the ones who mostly use existing ROWs, be it one of the former mainlines mentioned earlier or a route parallel to an existing railway.
Busways are also used whenever possible.
City
The city lines are limited to a single agglomeration, they use existing busways whenever possible and else will usually run along streets. These lines will use trams with a higher throughput, which means they have a lot of doors and standing room.
These lines are numbered with 2 digits, of which the first indicates the city it’s in;
- 10 - Eindhoven
- 20 - Tilburg
- 30 - Breda
- 40 - ’s-Hertogenbosch
- 50 - Helmond
- 60 - Roosendaal
- 70 - Bergen op Zoom
- 80 - Oss
- 90 - Oosterhout
Ring lines
Ringlines always start with an R, then the first letter of the city and then a digit.
Uneven digits go clockwise, even digits go counterclockwise.
e.g. RE1 is in Eindhoven and goes clockwise.
Network Considerations
While designing the overall network I had to consider where to lay down the routes. For cities, this meant considering various orbital and radial lines between areas. Here I had to carefully consider which streets to use to make connections to important landmarks. I also tried to consider whether a tram would fit in the first place.
On the regional lines it was very important to keep in mind the already existing railway network. The regional LRT network is supposed to connect places not otherwise connected by mainline railways.
This is also where the old railways mentioned earlier become relevant. These old ROWs have been used on lines A, B, H & J.
Especially Uden, Veghel and Schijndel have received much improved transit connection this way.
Major placement considerations for regional lines were the spacing the stops within towns, and whether to run along existing roads, or potentially take a more direct route.
Tools Used
To start out mapping, I downloaded the maptiles from OpenTopoNL. On this geographical map i started to draw lines using Adobe Illustrator.
After which, I started in Illustrator to make a small map for the individual cities within the province. These were eventually combined into the large map of the entire province. However, this was just a first version, not very compact at all. So, I started over from scratch. This time the entire map was built in one go, starting from Eindhoven and working outward from there.
Lastly, the registry of stops was made in Excel, using the layer info from a .svg file as a data source.